Institute of Clinical Molecular Biology Kiel
Pursuing questions on how genes, individual life history and environmental factors interact to cause chronic diseases.
News and Highlights
Career Opportunities
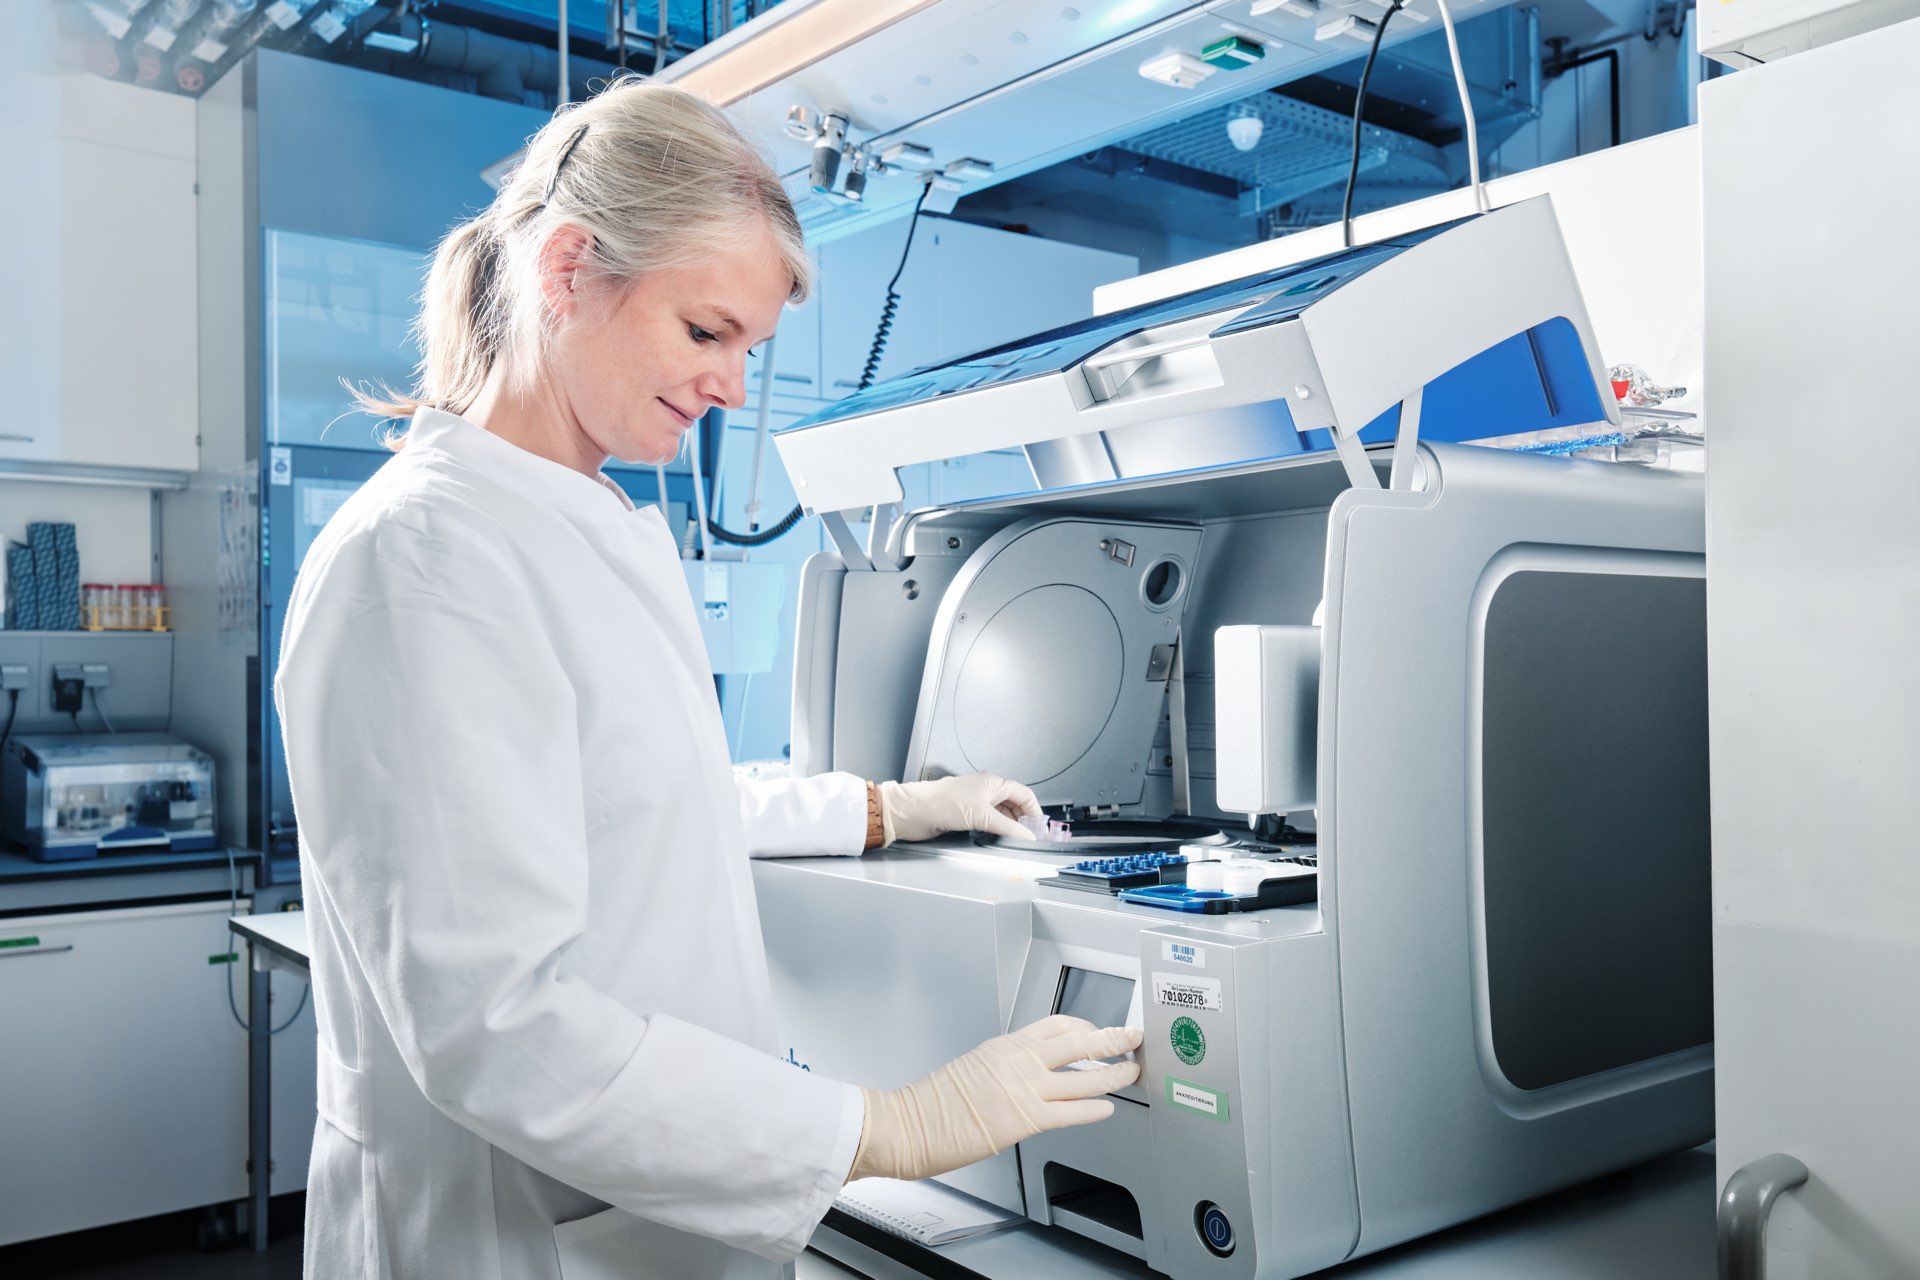
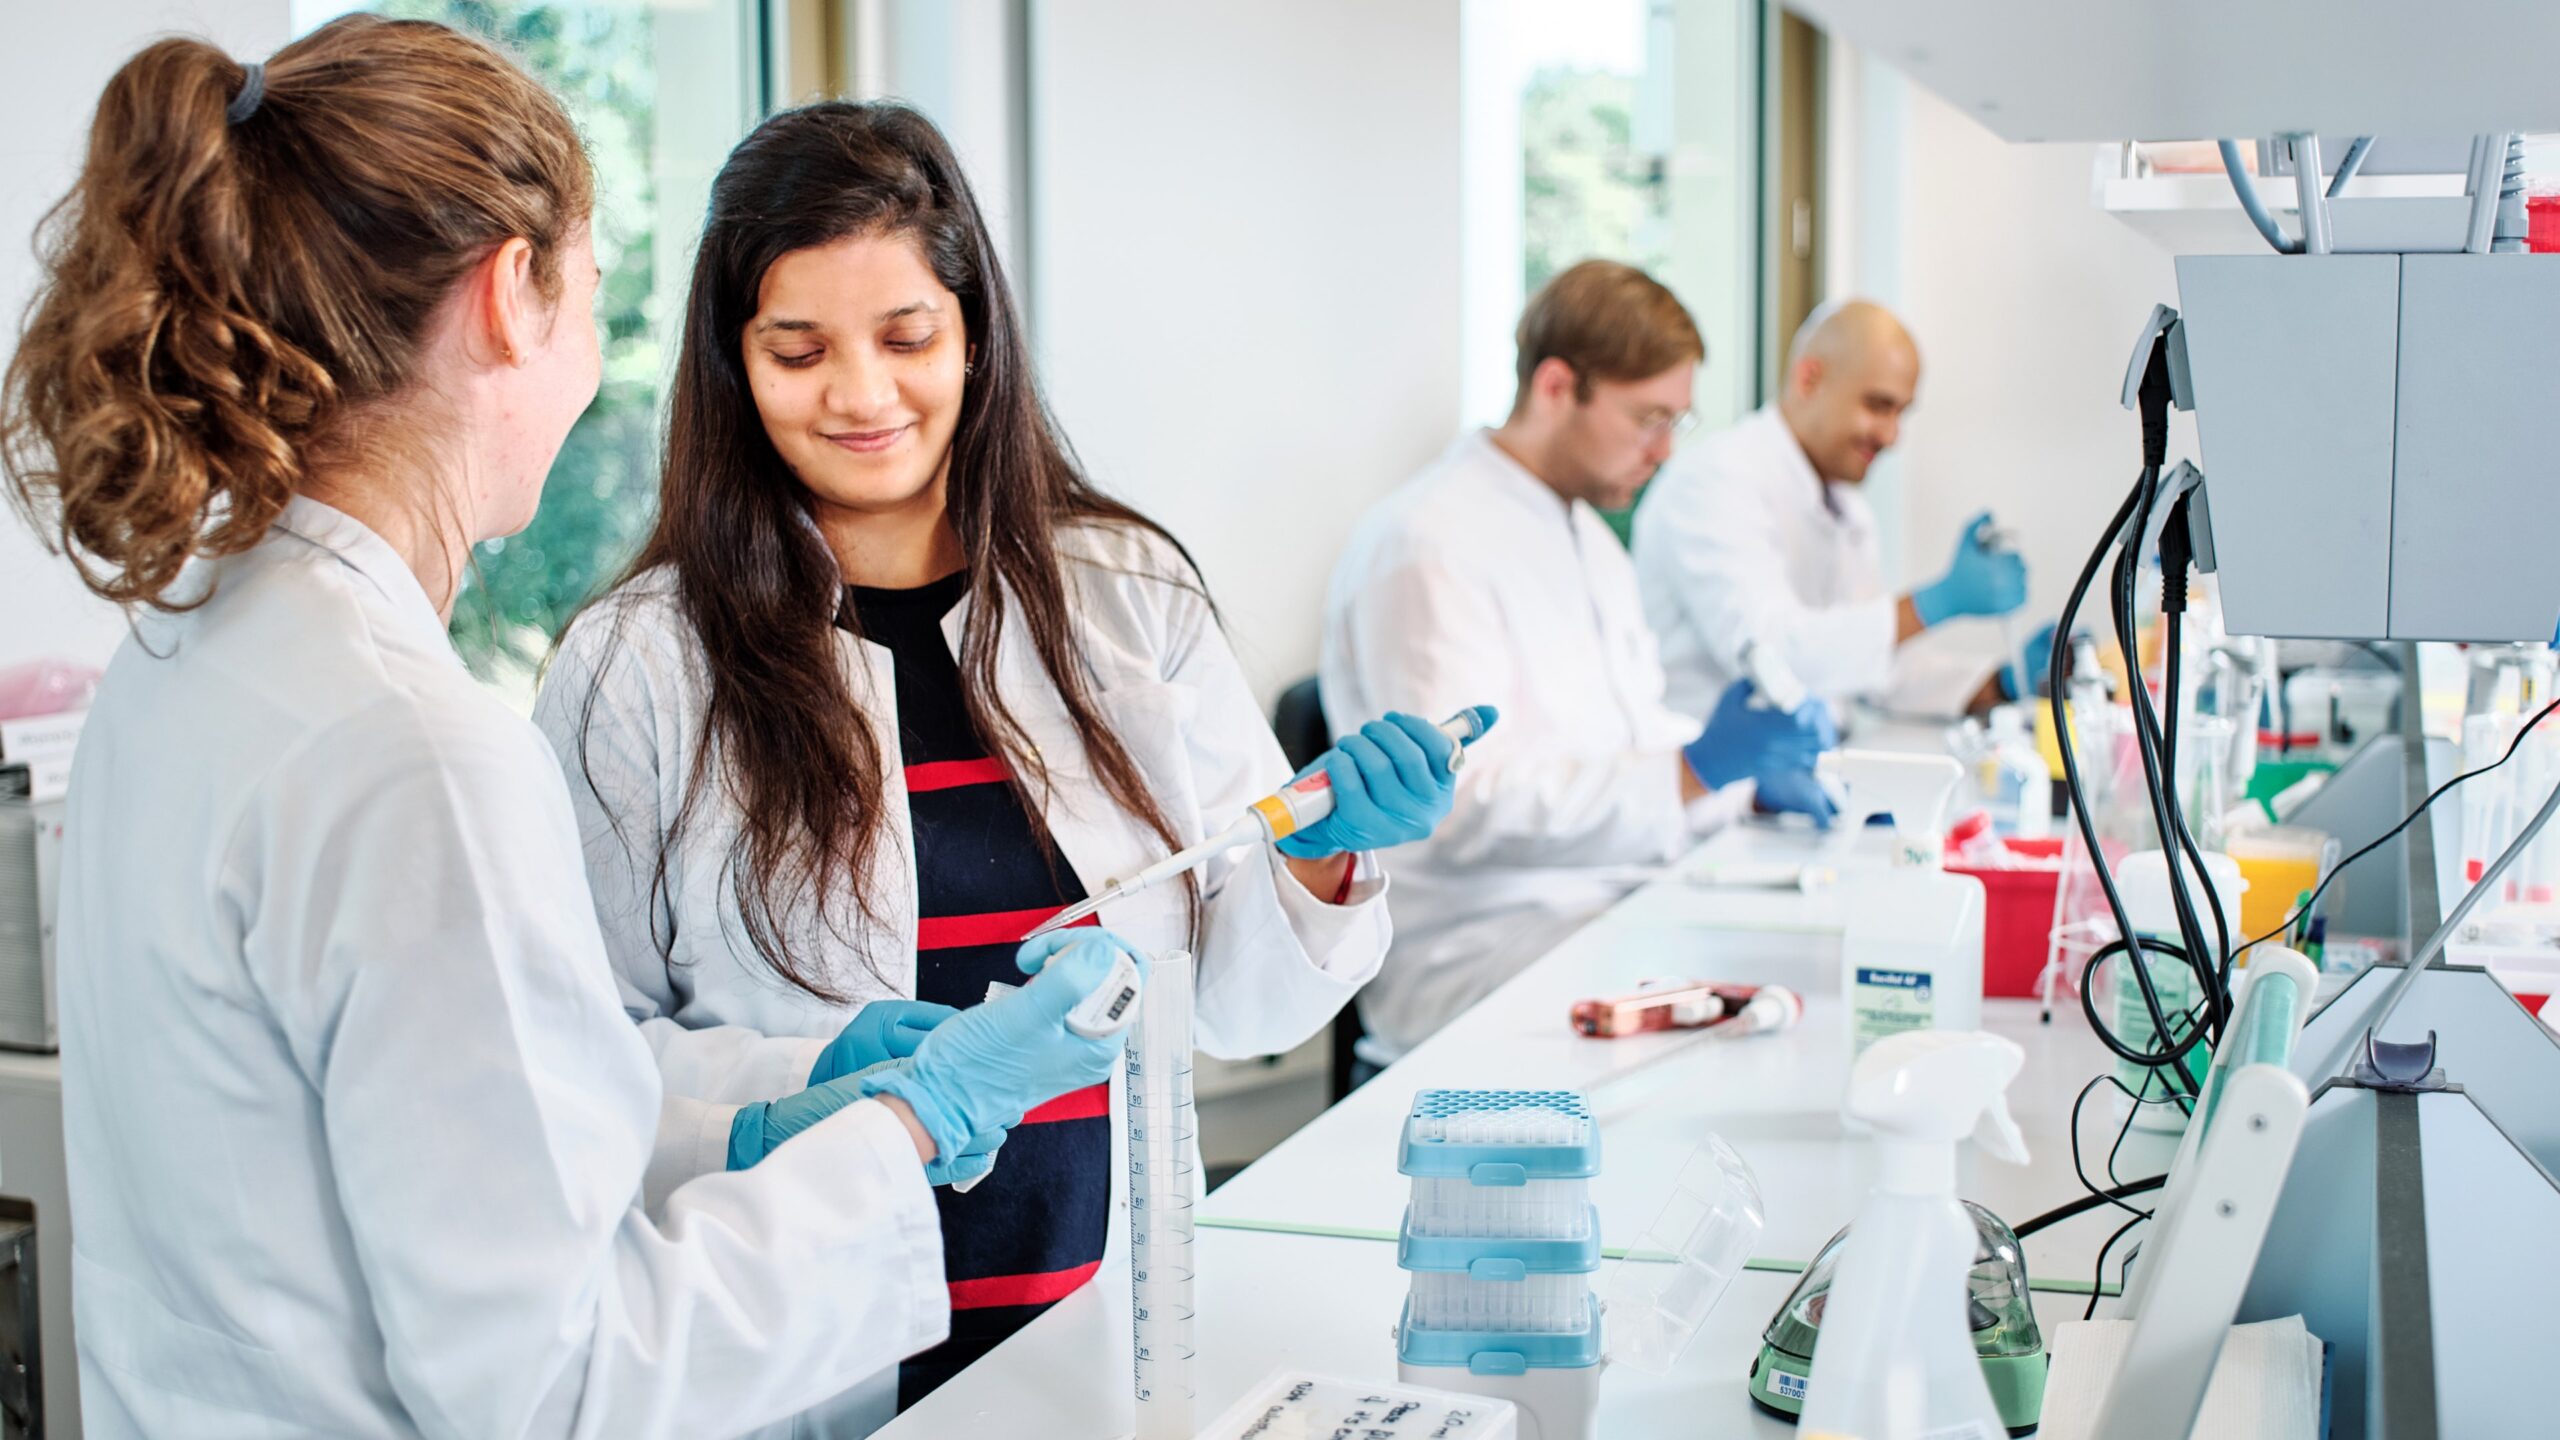
We always look forward to excellent applications in order to expand our scientific team. The Institute provides an inspiring working environment for scientists from all over the world. The spectrum of innovative and visible individual research groups as well as access to well-equipped technical resources ranging from large-scale genotyping, high throughput sequencing, state-of-the art microscopy to a large bioinformatics unit make this a special place to work.
Please send your electronic application consisting of a CV and a statement why you would like to work at the IKMB to the respective group or to our main office.
Research